
Congress Session Spotlight: What Owners Want and How to Measure It
How can project teams build their own performance metrics from the ground up, instead of inheriting someone else’s rating scale? Learn how a novel tool, the taktometer©, was developed to help teams achieve shared meaning and craft metrics around project needs that owners agree are critical to success. These include collaboration, innovation, and robust project controls, all essential in Lean projects and processes.
At the 2026 LCI Congress, Neil Kaufman, Director of Project Integration at BA, Kevin Dewlen, Senior Lean Coach at BA, and Troy Stahlecker, Director of Project Delivery at California Polytechnic State University, San Luis Obispo, will explore all this and more during What Owners Want and How to Measure It. Their session will examine how teams can create valid, reliable, and durable performance metrics for their own teams and projects—and most importantly, how project teams that participate in developing their own measures of success are much more likely to achieve them.
Attendees will gain actionable takeaways while diving into project owners’ Conditions of Satisfaction from three concurrent Lean megaprojects where this played out: an IPD manufacturing facility (Wolfspeed, Siler City, NC), a progressive design-build student housing program (California Polytechnic State University, San Luis Obispo), and a design-bid-build medical center expansion (Cleveland Clinic Fairview Expansion). Learn more in our interview with Neil Kaufman and Kevin Dewlen.
Don’t miss this session and much more at the 2026 LCI Congress, October 12-16, in Atlanta, Georgia! Register today.
Q. Please share a sneak peek of some of what you’ll cover in this session.
Introducing the taktometer.
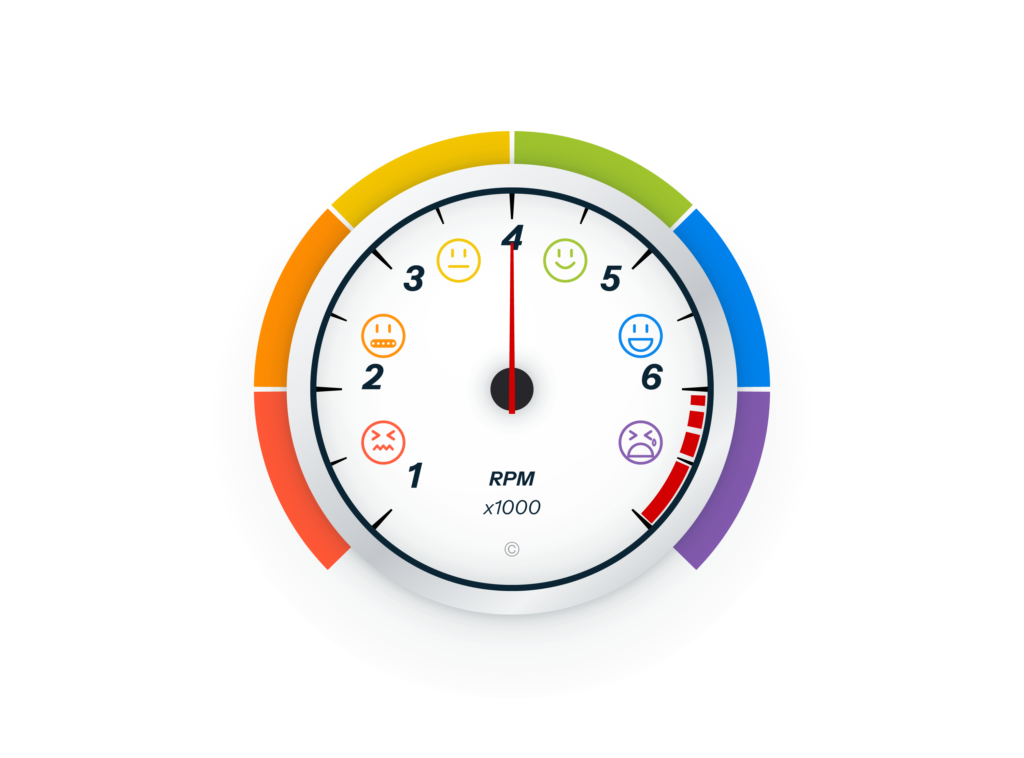
We’re introducing a simple tool called the taktometer, a way for project teams to build their own performance metrics from the ground up, instead of inheriting someone else’s rating scale.
Neil: “We’re introducing a simple tool called the taktometer, a way for project teams to build their own performance metrics from the ground up, instead of inheriting someone else’s rating scale.
The taktometer is a tool that we developed at BA (previously Boulder Associates). The first ideation around it was about three years ago. It’s analogous to an engine tachometer, which in some instances measures engine health and engine performance.
We work with metrics a lot, particularly human performance-centered metrics, and as we all know, they’re tricky. So we thought, how do we get our arms around measuring human performance as related to Conditions of Satisfaction through Lean construction principles? You can try it numerically or qualitatively, but could we create something that does both at the same time and covers a lot of bases? We feel the answer is yes.”
Measuring human performance flow: collaboration, innovation, and more.
It’s these outer band or second-tier Conditions of Satisfaction, like collaboration and innovation, that owners and teams talk about. When you try to measure those, it’s much more difficult.
“The taktometer is about human performance flow, and it lets us use a multivariate method to measure people’s perceptions around performance when you get the conditions of Satisfaction. The primary ones—budget, schedule, quality, and safety—are well-established performance metrics. There’s a lot of good numerical options out there already. People can qualify those numerical scores if they are using a scoring rubric.
It’s these outer band or second-tier Conditions of Satisfaction, like collaboration and innovation, that owners and teams talk about. When you try to measure those, it’s much more difficult. It becomes personal perception and opinion, so we created a tool that allows everyone to get on the same page and create what we call shared meaning, which is critical. The underlying concept from organizational behavior literature is that when people are allowed to participate in the creation of their own measures of performance, they have a much higher likelihood of actually achieving or exceeding them.”
Q. Could you share some of the insights into project owners’ Conditions of Satisfaction from the three projects you’ll discuss?
Kevin and Neil offered a summary to start:
- The throughline across all three projects we’ll discuss is that owners rarely disagree on what matters: collaboration, innovation, robust controls; the friction is almost always in how it gets measured, and whether the team ever agreed on what “good” looks like in the first place.
- On the Cal Poly project (a progressive design-build student housing program), we could directly compare what the owner asked to be measured against what the design-builder proposed measuring, and the gap between those two lists is itself a useful diagnostic.
- For Troy, as the owner, the tool mattered less as a scoring mechanism and more as a forcing function. It made the team define success together instead of assuming everyone meant the same thing by “good collaboration.”
An exercise in measuring collaboration.
Kevin: “We did an exercise with the owner and the general contractor. At first, it was to help define what they felt collaboration was between the two, and it was done a little differently than the traditional exercise. It was done in separate rooms with separate interviews.
What was interesting was that at first glance it seemed like the general contractor and the owner at Cal Poly were on completely separate pages of what collaboration meant for this project. But when the results came back, and what each partner thought of collaboration was shared, they were not far off from each other in terms of what they felt a collaborative project is, and what a collaborative team is.”
Neil: “So that was the mechanics of how we worked with and developed the tool further on the Cal Poly student housing program. But what was particularly interesting was realizing the team was wrestling with how to be more collaborative.
How collaborative are we?
They were seeking more collaboration, but until they created this shared meaning around it, they couldn’t answer the question when they all got together: how collaborative are we currently? And what are we trying to get to?
They were seeking more collaboration, but until they created this shared meaning around it, they couldn’t answer the question when they all got together: how collaborative are we currently? And what are we trying to get to? The taktometer helped them have those conversations.
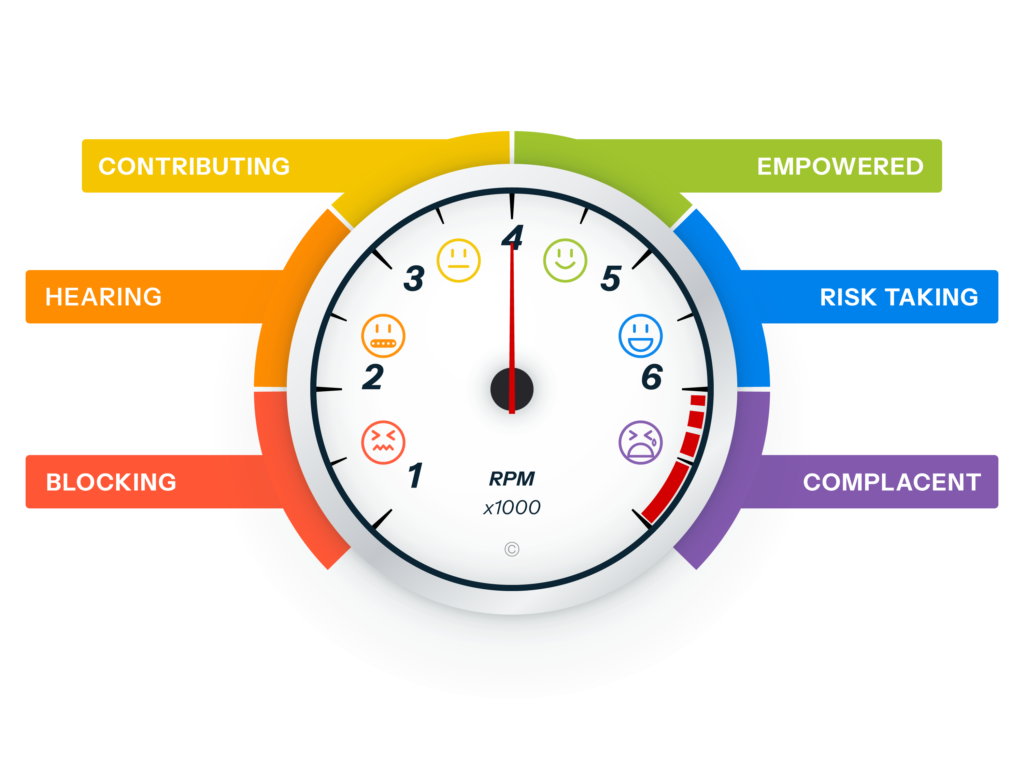
For some people, it was about the numeric component. It was: we’re kind of a 2 or 3, and we want to get to a 4 or 5. Interestingly enough, and Troy will elaborate on this in our presentation, people were very aligned with the color scheme: that the blue and green area on the meter was that sweet spot. Troy started having conversations with people about how we’re in this red, orange, yellow zone, but we are trying to get to the green and blue zone. People related to that at an almost visceral level. It was a pleasant surprise realizing that it wasn’t just the words and the numbers. The visuals and icons were very powerful at helping them get on that same page that Kevin was talking about.”
Q. Please tell us more about the taktometer tool and how it helps teams succeed.
The core idea is that before you can measure something like collaboration, a team has to build shared meaning around what a 1 looks like versus a 5.
Kevin: “The taktometer represents team performance three ways at once: numerically, verbally, and visually with color and expressive icons/emojis, so a rating isn’t just a number floating in space. It’s tied to language and imagery the whole team actually agreed on. In addition to being a tool to communicate and come up with a shared meaning, it also touches on different analytical and personality styles. Some people are drawn to the numbers. Troy was drawn to the colors. We haven’t had anyone truly call out the emojis yet, but maybe it appeals to people when they think about the colors in that sense that everybody’s smiling when it’s green.
The core idea is that before you can measure something like collaboration, a team has to build shared meaning around what a 1 looks like versus a 5. Otherwise, everyone is rating a different thing under the same word.
It was actually born out of necessity. On our Wolfspeed project (an IPD manufacturing facility), we needed a fast way to get a team-wide read on something as fuzzy as ‘how giving is this team,’ and the first version of the tool came out of that exercise.
The Redline Effect concept.
The ‘Redline Effect’ concept extends it further: it’s not just ‘more is better.’
The ‘Redline Effect’ concept extends it further: it’s not just ‘more is better.’ Teams can push a metric past a healthy point, and the tool is built to show that visually. You can be contentious, too psychologically safe; or you can be a martyr, too giving. So we have the typical 1 through 5. And when we creep over into that 6, that purple, this is more of a corrective measure. We say, ‘How often do you feel contentious?’ And then we go back to the team, and we have a discussion that, ‘Okay, this is something that happens, but not very often.’ Maybe you feel overburdened a couple of times a month. When it starts to creep in frequently, or always, then it becomes a true sit-down with owners, with the core group of the team, to figure out what’s going on. Luckily, we have not had to go into that yet. But it’s interesting to see the team come together each quarter and talk about these things that don’t get discussed very often.”
Neil: “Adding to Kevin’s point about that red zone in the taktometer, which is analogous to an engine tachometer, is that high-performance racers know that they can move into that red zone for very small, discrete periods of time. But it’s when you’re living in that red zone that performance starts breaking down. So that’s the analogy that we make.”
Q. What do you hope attendees gain from this session overall?
Kevin and Neil agreed on these key takeaways for attendees:
- That building your own metric, even an informal one, is genuinely something a team can do in an afternoon, not a multi-month initiative.
- The specific insight we keep coming back to: teams that participate in developing their own measures of success are far more likely to actually achieve them. That’s the whole thesis of the talk.
- A concrete first step: pick one Condition of Satisfaction your team already agrees matters, and get the words right before you ever assign it a number.
This will help our audience recognize that not only can they measure it, but they can measure it effectively, and they can create a metric very quickly.
Neil: “We’re putting the finishing touches on a live app that we intend to use during our presentation. Instead of telling the audience about what we’re doing, we’ll actually run them through this quick exercise. We’ll run through 1 through 6, and we’ll ask the audience, using their phones, to type in words that they associate with different levels of collaboration and vote on which one they think is the most representative word. In 15 minutes, the audience will create a metric around collaboration. One of the lessons there is that you don’t have to struggle for weeks and months, or throw up your hands and say, ‘this is important to us. It is a Condition of Satisfaction, but we just don’t know how to get our arms around it. We don’t know how to measure it.’ This will help our audience recognize that not only can they measure it, but they can measure it effectively, and they can create a metric very quickly.
I’ve done a lot of presentations, and I’ve been present for a lot of presentations. And when you get that little live component in a 40-minute presentation, it can take the presentation to the next level. So we are courageously moving forward with that, but we also recognize that there’s a risk if the technology somehow doesn’t cooperate. But we’re not going to let the fear and the potential of what could go wrong stop us.”
Q. What are you looking forward to at Congress?
When we get together with all of our folks at LCI, there is a lot of shared meaning in the room, and it’s encouraging.
Neil: “For me, it’s about getting with the choir and singing again. Because we’re off doing our own projects, and we see the broad spectrum of Lean application. On some of our projects, we see teams struggle with applying Lean, mostly for lack of formal training and knowledge. They ask, ‘We’ve been doing it this way for our entire careers. Why are you asking us to do new things?’ Those types of issues can be frustrating. But when we get together with all of our folks at LCI, there is a lot of shared meaning in the room, and it’s encouraging. It gives me a lot of hope that we can continue doing this work and show our industry the benefits of what we do with Lean. Being around like-minded folks who get it can be therapeutic.”
Kevin: “I most look forward to coming together with like-minded folk within the Lean industry.
And we are trying to get more of our team to be aware of LCI and attend Congress. It’s always interesting for me to see new owners, new contractors, who are at their first Congress, and the eye-opening experience that comes from it and the conversations that evolve from that. It’s good to see the people who we know, but it’s also exciting to see new faces, new people, new connections, and keep doing good work.”
Who Should Attend this Session
- Project owners who want a better way to communicate what “success” actually means to their teams, beyond a generic scorecard
- Design and construction teams working under IPD, progressive design-build, or any collaborative delivery model where shared meaning across parties is make-or-break
- Anyone who’s ever sat in a room disagreeing about what a “3 out of 5” is supposed to mean
- Researchers and academics interested in advanced metrics for human performance
What You’ll Learn Recap
- This session introduces a simple tool called the taktometer, which is a way for project teams to build their own performance metrics from the ground up, instead of inheriting someone else’s rating scale.
- It walks through three real megaprojects where this played out: an IPD manufacturing facility (Wolfspeed, Siler City, NC), a progressive design-build student housing program (Cal Poly), and a design-bid-build medical center expansion (Cleveland Clinic Fairview Expansion).
- Neil, Kevin, and Troy will run part of the exercise with the audience in real time, using an app, so attendees experience how it works rather than just hearing about it.
- The session will introduce a concept called the “Redline Effect”: the idea that pushing a metric too hard doesn’t just plateau; it can actively work against you, the same way redlining an engine does.
- Building your own metric, even an informal one, is genuinely something a team can do in an afternoon, not a multi-month initiative, and teams who participate in developing their own measures of success are far more likely to actually achieve them.
Learn more about this session and the rest.
Explore the LCI Congress interactive agenda for more on this session and the entire program, including several more sessions covering relevant, actionable AI topics.
Join us at the 2026 LCI Congress for this session and more!
Register today for the 28th Annual LCI Congress in Atlanta, GA.
Need to make the case for the 2026 LCI Congress?
Use our customizable employer request template to highlight the benefits of attending LCI Congress.
Questions on the Congress program?
Contact Joan Piccariello with any questions about the Congress program.